
IndiskaAI Logo
Back
Genomics · Biomarker Discovery

Turn Transcriptomic Data into Research-Ready Evidence.

Bulk RNA-seq, assessed sample by sample, compared between groups and placed in pathway context — with candidates and their limits stated. For research use only.

Reads to signature
01 / 04
In

Paired-end reads from your samples, with their groups.

Biomarker types

What is a biomarker analysis for?

Biomarker analysis aims to identify and prioritise molecular features associated with a condition, a phenotype or an outcome. Whether a feature is useful depends on the question asked. The main categories below are not interchangeable, and one analysis does not establish all of them. This service addresses the diagnostic question.

  • DiagnosticThis service

    Does a pattern distinguish samples with a condition from those without? This is the question the workflow implements, for tumour versus normal tissue.

  • Prognostic

    Does a pattern relate to the likelihood of an outcome, such as survival, whatever the treatment? Not implemented. A study design has been drafted, and no prognostic analysis has been run.

  • Predictive

    Does a pattern identify differences in the likelihood of response to a specific treatment? This needs treatment-arm data and a defined treatment context. Not offered.

  • Pharmacodynamic or response-monitoring

    Does a measure change with exposure to, or response to, an intervention? Needs repeated samples around that intervention. Not covered here.

  1. 1
    Input data

    Sequencing reads from patient samples

  2. 2
    Signal

    Genes whose activity differs between patient groups

  3. 3
    Processing

    Noise filtered out, the signal tested and modelled

  4. 4
    Candidates

    A small set of genes that separates the groups

  5. 5
    Interpretation

    Candidates and their evidence, for your team to examine and test further

What a signature can and cannot do

A candidate set can suggest which genes separate the groups in your cohort, so your team can decide what to test next. It is a hypothesis from one dataset. It does not show that those genes cause the difference, it does not establish clinical utility, and it does not predict who will respond to a treatment.

Services

What we provide

Take the complete biomarker discovery service, or start from whichever stage your data is at.

End to end

Biomarker Discovery, End to End

From paired-end RNA sequencing reads to a short list of candidate biomarkers that separate your groups.

You receive
  • Candidate biomarkers, with the direction of change for each
  • The selection rules each candidate met, including a leave-one-out robustness check
  • Differential expression and pathway results with their statistics
  • A written report with result tables and figures, and a record of the run

Requires the group of each sample. Results describe the cohort supplied and need independent validation before they support any decision.
Data processing

Sequencing Data Quality Assessment

Find out whether your RNA-seq data is fit for analysis before investing further.

You receive
  • Per-sample quality report
  • A summary of any issues found
Data processing

RNA-Seq Data Processing

Raw sequencing reads turned into an analysis-ready gene expression matrix.

You receive
  • Gene-level counts matrix
  • A processing quality summary
Expression analysis

Differential Expression & Pathway Analysis

Identify the genes that change between your groups and the pathways behind them.

You receive
  • Gene list with fold changes and adjusted p-values
  • Enriched pathways, and plots
Pathway analysis

Add biological context to a biomarker list.

A list of candidate genes says what changed, not why it matters. Pathway analysis asks which biological pathways and processes those genes are associated with, using the expression data you supply and published pathway annotations.

Research value: enrichment gives hypotheses to investigate. A pathway association does not establish causality, clinical utility or validated biomarker performance.

What pathway analysis can help with
  • Explore associated processes

    Which biological processes are linked to the candidate genes or the genes that differ between groups.

  • Identify enriched pathways or themes

    Which pathways contain more of your genes than expected by chance, with adjusted statistics reported.

  • Relate markers to mechanisms

    Place individual candidates in a wider biological setting, as a basis for discussion rather than a conclusion.

  • Develop hypotheses

    Suggest what to examine next in follow-up experiments or independent datasets.

Integrated workflow

Conceptual workflow. Select a step to read it.
Step 1 of 6

Input dataset

Paired-end RNA-seq files (FASTQ) or a gene counts matrix, with the group each sample belongs to.

Pathway enrichment appears in this service as the Differential Expression & Pathway Analysis package. The wider interpretation described here depends on the gene annotation sets used, and the sets are stated in the report.

Sample outputs

Results you can see, not just read

Every expression analysis comes with clear figures, so you can see what changed and where to look next.

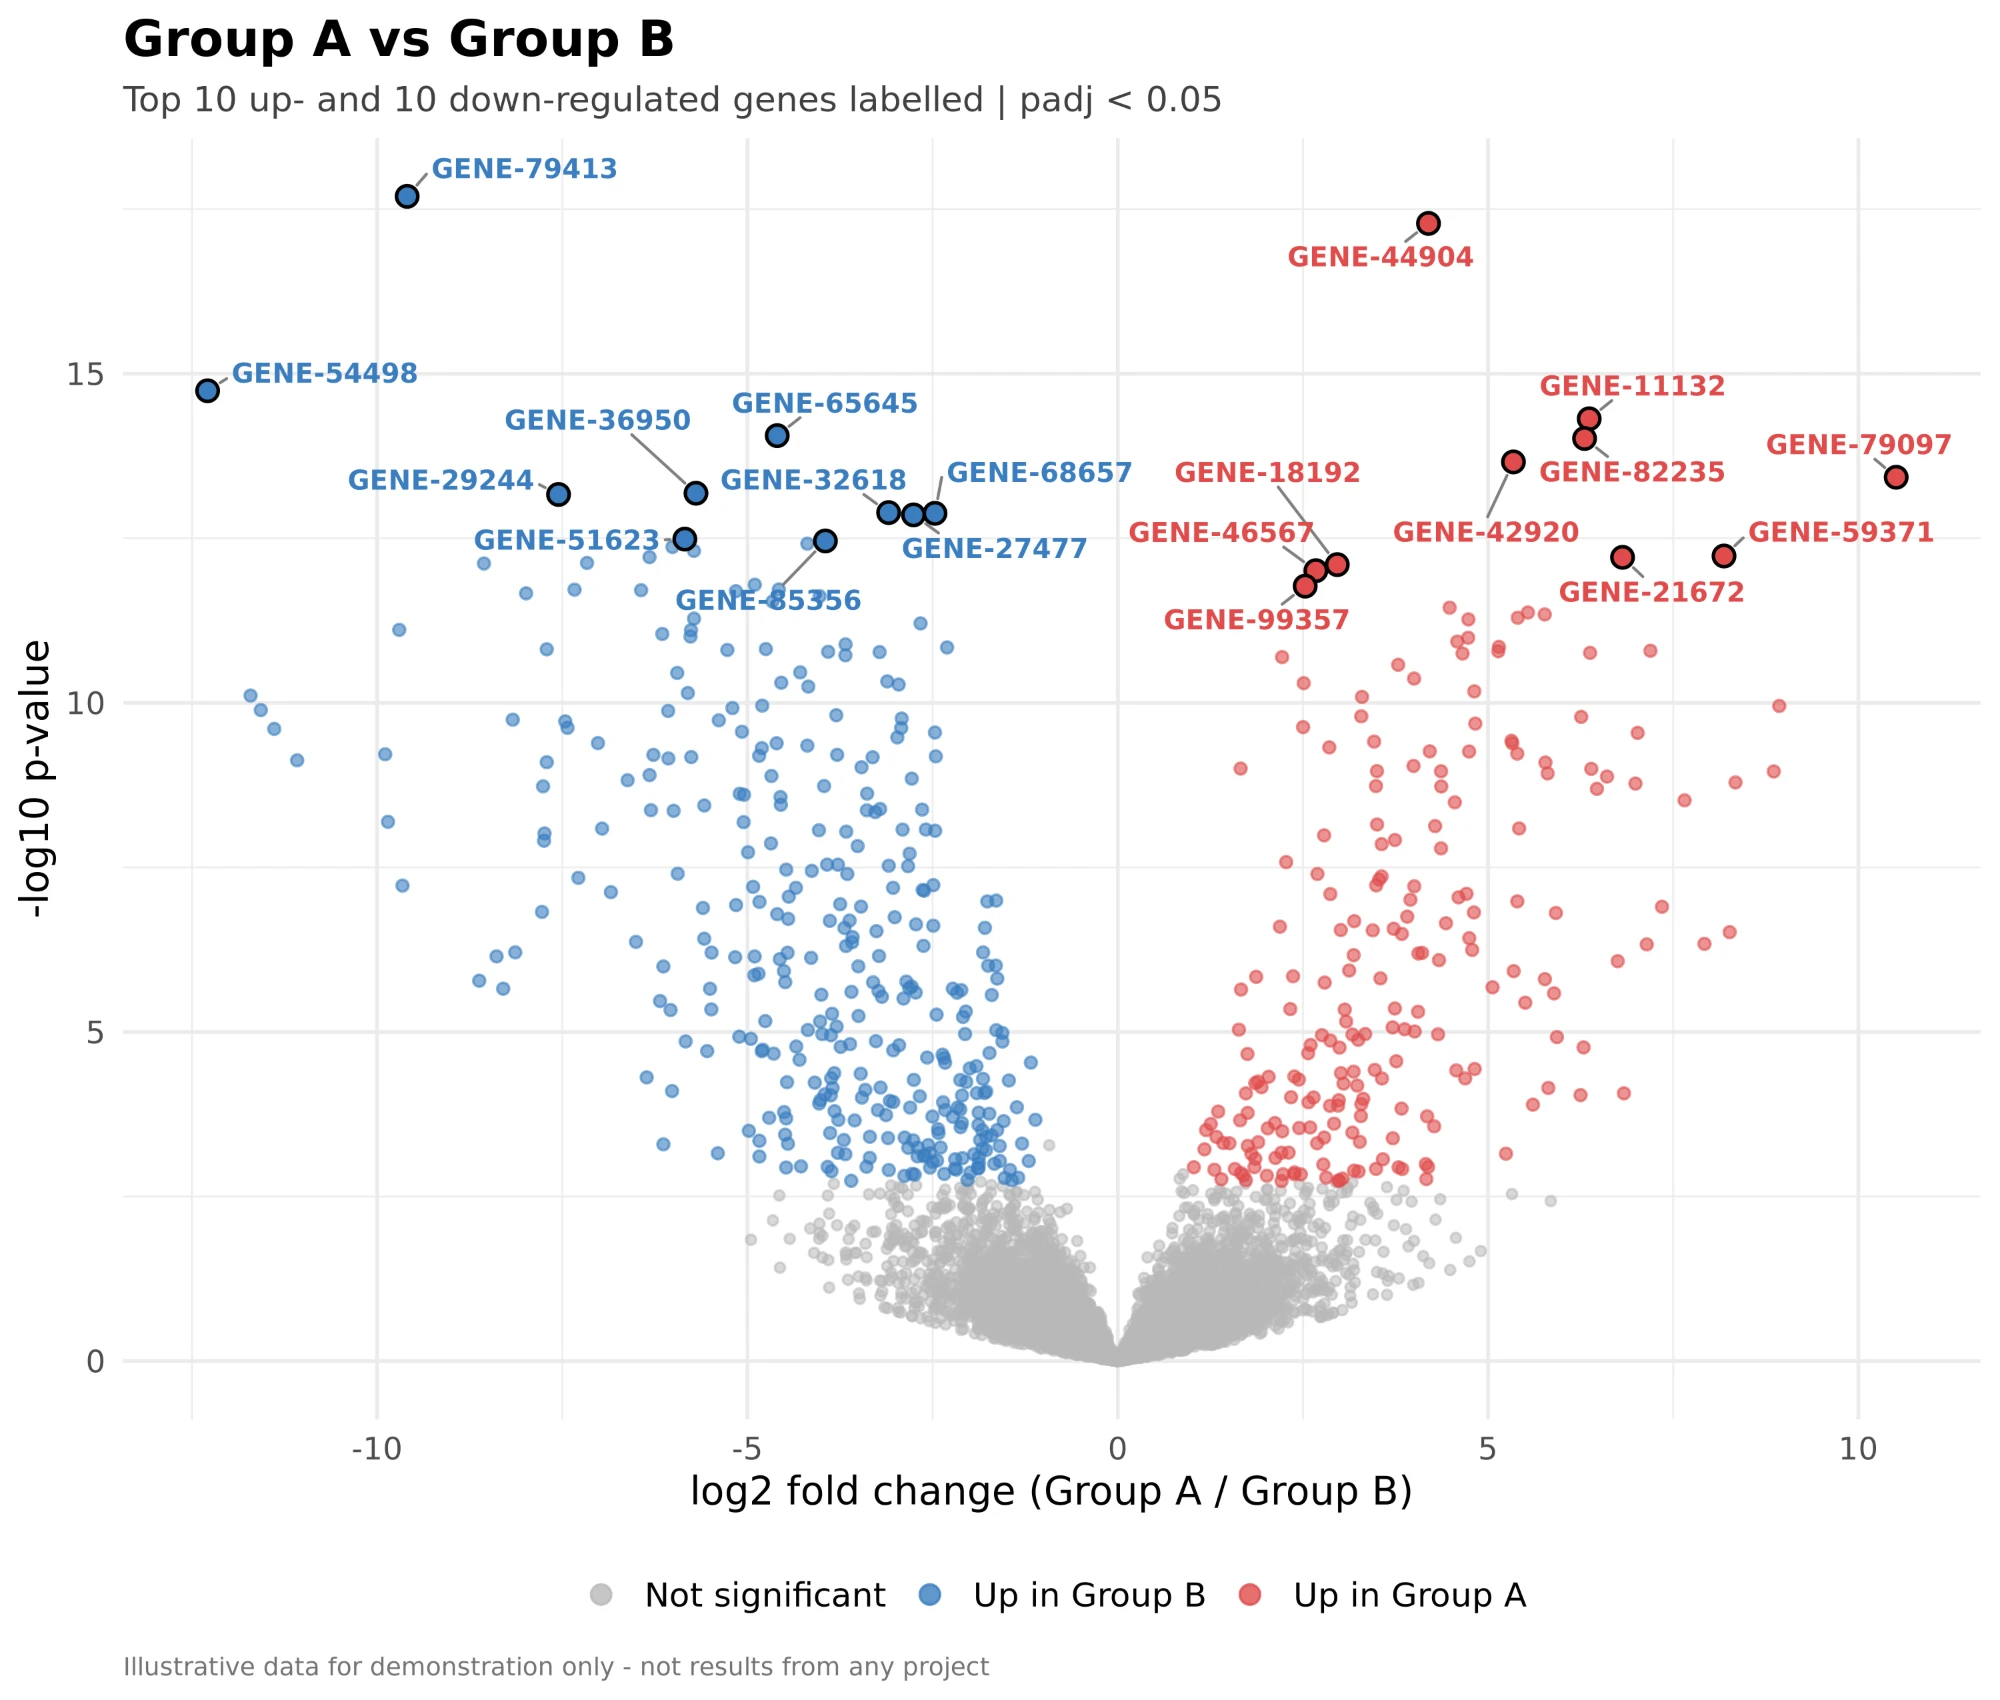
Volcano plot of log2 fold change against statistical significance, with the top up- and down-regulated genes labelled
Volcano plot

Every gene in one view: how much it changes between groups, and how strong the evidence is. The strongest genes are labelled.

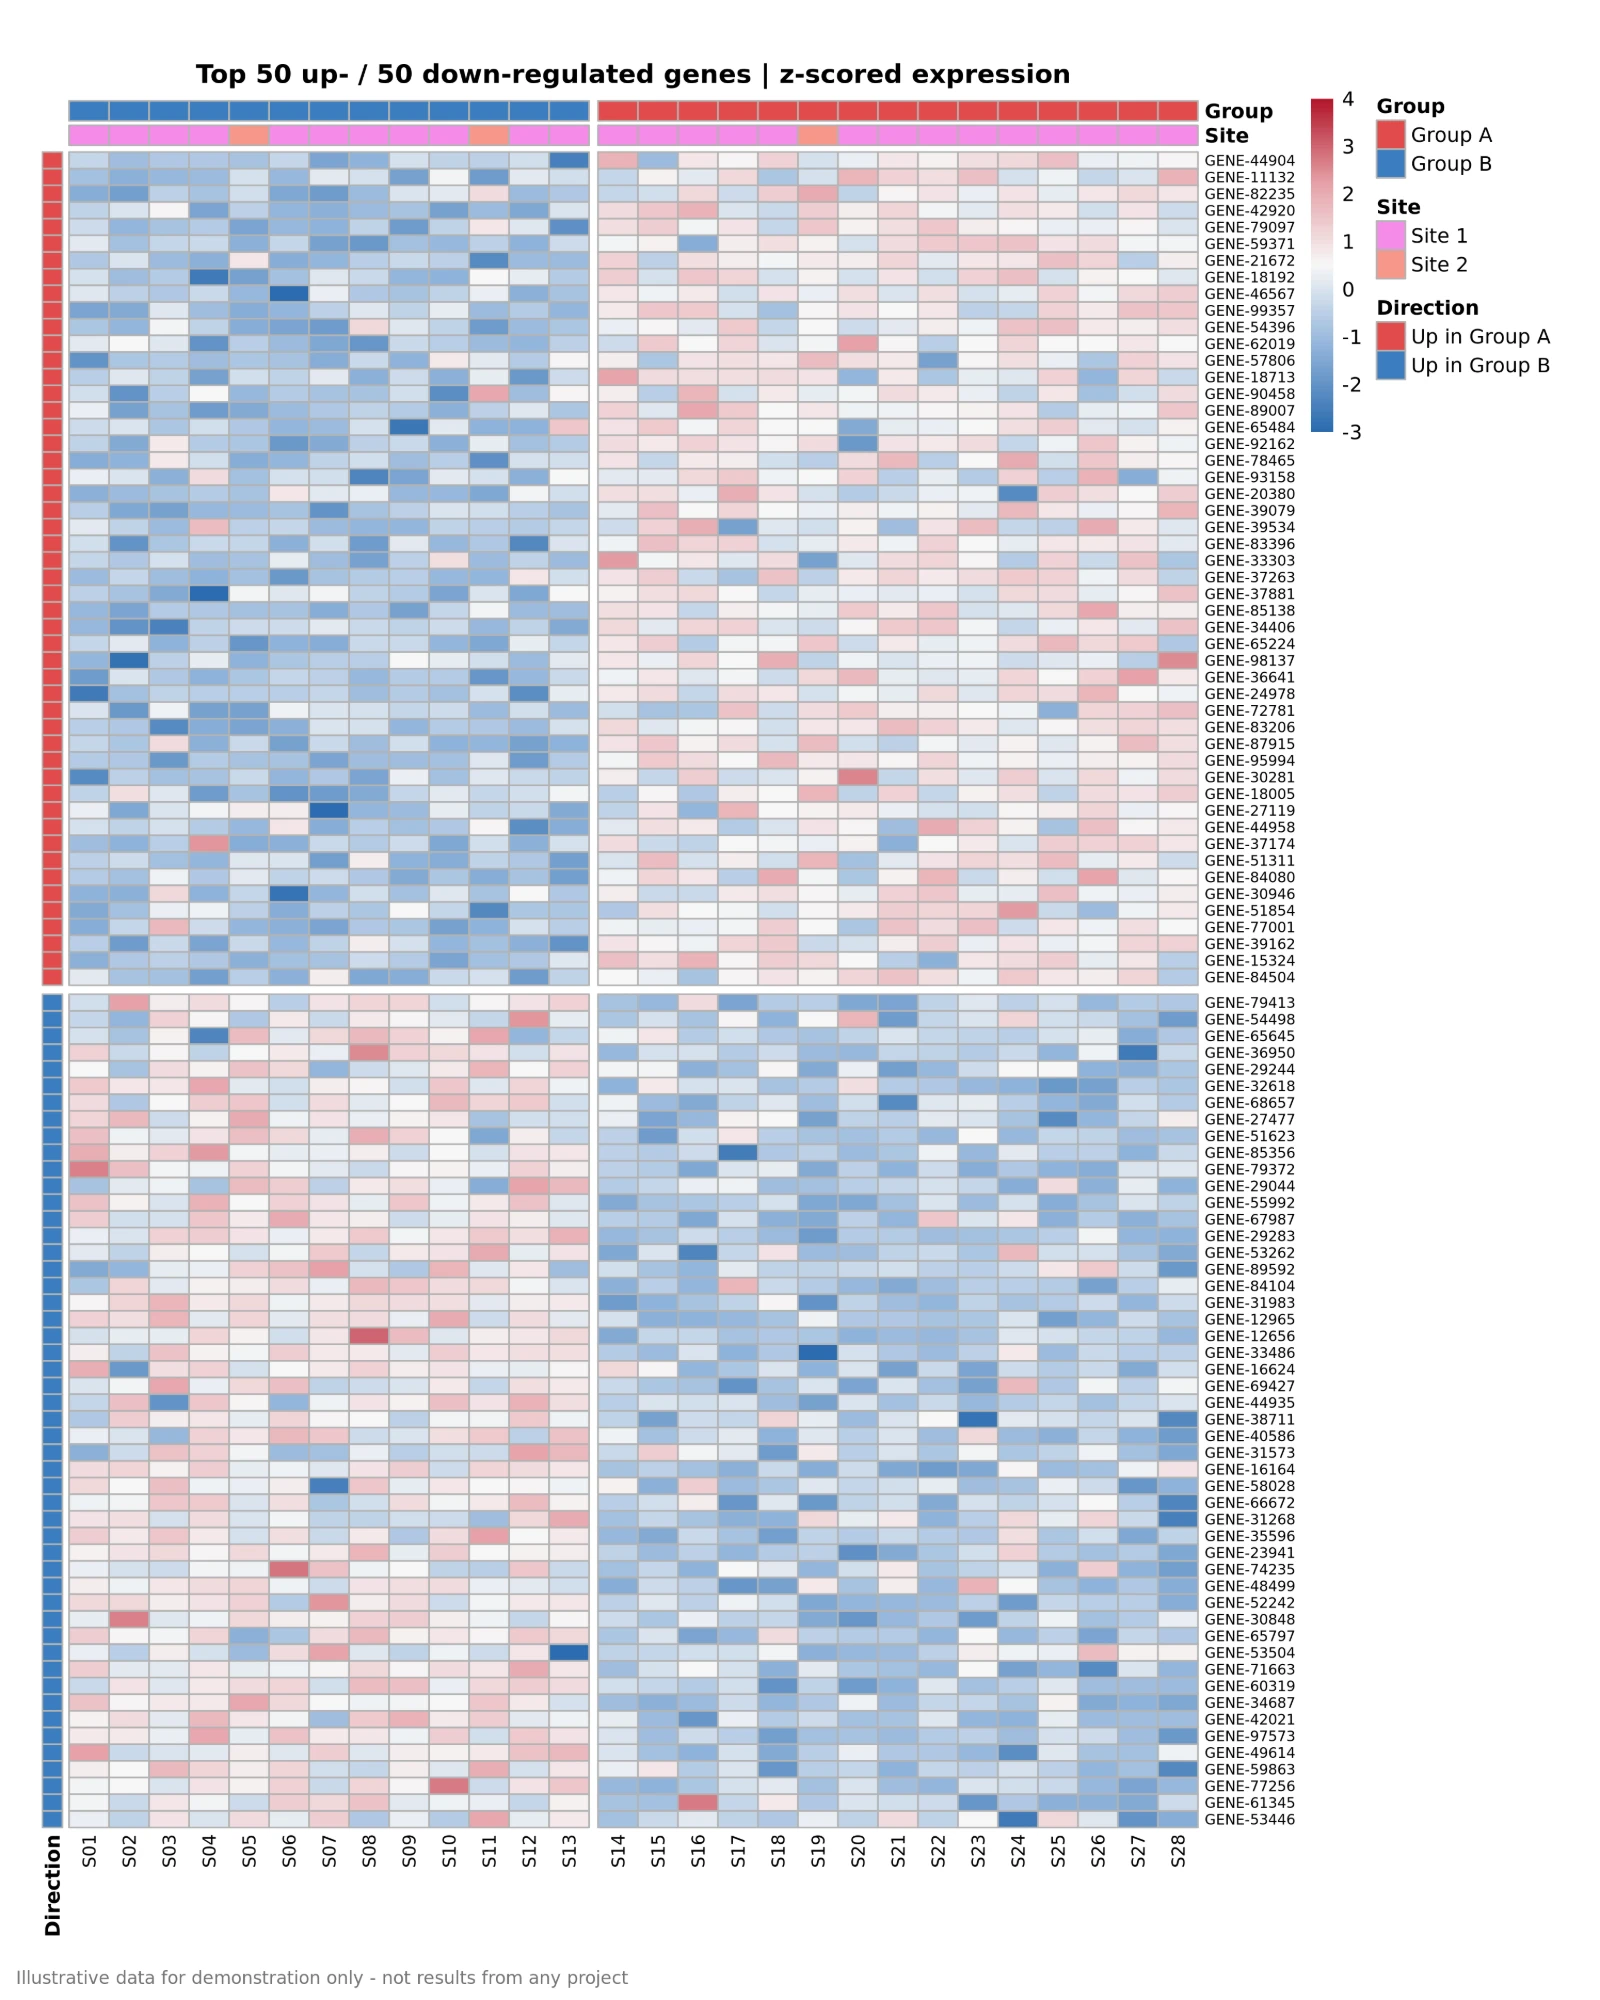
Expression heatmap of the top up- and down-regulated genes across every sample, grouped and coloured by z-scored expression
Expression heatmap

The top changing genes across every sample, showing how consistently each group behaves.

Right side, red

Genes more active in your first group.

Left side, blue

Genes more active in your second group.

Higher up

Stronger statistical support for the change.

Figures shown use simulated data for illustration only. They are not results from any project.

Evidence

How results are qualified

Robustness, not one lucky split

A candidate must keep passing when each sample is left out in turn. Genes that hold only in one arrangement of the data are not reported as candidates, and when too few refits are possible the rule is reported as not evaluable rather than passed.

A locked model, applied not retuned

Where a fixed signature model already exists for the supported question, it can be applied to score samples without any retuning, with its files checked against their hashes at the start and end of every run. Its contents are not published here.

Limits stated

Results come with effect sizes, statistical support, cohort size and number of events, and a statement of what the data cannot support.

Scope & limitations

For research use only. Not a clinical or diagnostic device. Candidate findings require appropriate independent validation, and this service does not provide clinical advice. The Genomics & Biomarkers platform page sets out the full scope, the supported question and what the workflow does not establish.

Getting started

How to work with us

  • Complete biomarker discovery
    You provide:
    Paired-end sequencing files + sample groups
    Services:
    All stages
  • Discovery from counts
    You provide:
    Gene counts matrix + sample groups
    Services:
    Stages 2–3
  • Expression analysis only
    You provide:
    Gene counts matrix
    Services:
    Stage 2
  • Data quality check
    You provide:
    Raw sequencing files or counts matrix
    Services:
    Stages 1–2
What we need from you
  • RNA sequencing files (FASTQ) or a gene counts matrix
  • Sample information, including each sample's group
  • The research question the comparison should answer

Have a biomarker question?

Tell us about your study and data, and we'll suggest where to start.